What dynamic metrics are available for my country/area of interest?
UNBL offers at-a-glance metrics based on the best available global spatial datasets. These metrics can be used to report on the state of nature and human development for places available on the UNBL public platform and/or those that you have uploaded to your workspace (see our workspace guide for more information on this). Available standard metrics include:
- Global Land Cover (2022)
- Land Cover Change (1992-2022)
- Protected Areas (2026)
- Protected Connected Index (2026)
- Tree Cover Loss (2001-2025)
- Monthly Fire Activity (2001-2025)
- Biodiversity Intactness Index (2015)
- Terrestrial Carbon Density (2010)
- Enhanced Vegetation Index (2001-2025)
- Terrestrial Human Industrial Index (2000, 2005, 2010, 2013)
- Coastal Eutrophication (2007-2024)
UN Biodiversity Lab additionally offers two headline indicators which are available as set out in the indicator metadata associated with Monitoring Framework of the Kunming-Montreal Global Biodiversity Framework (CBD/DEC/COP/15/5; CBD/DEC/COP/16/31), which is available on the Kunming-Montreal Global Biodiversity Framework Indicators website and in CBD/COP/16/INF/3/Rev.1:
- Sustainable Agriculture (Headline Indicator 10.1)
- Sustainable Forest Management (Headline Indicator 10.2)
It is important to note that eight of the standard metrics can be displayed for places of any type (countries, administrative areas of any scale, geographic areas, etc.), whereas the two headline indicators, Protected Areas, and the Protected Connected Index metric can only be displayed for places that are countries. Additionally, the coastal eutrophication metric is only calculated for places that are marine. This metric can be viewed for marine places, as well as countries with a coastline that have associated marine places. To learn more about the datasets underlying each of these metrics and how the metrics can be used for monitoring and reporting, please see the table below.
Table 1: Information on eleven standard metrics and two headline indicators offered on UNBL
| Name | What metric does this calculate? | What dataset is used to calculate this metric? | How can this be used for monitoring? |
|---|---|---|---|
| Global Land Cover | Percentage of land cover classification represented within location. | This metric is derived from the Global Land Cover data layer (ESA), at 300m resolution, from the year 2022. | This information can be used to monitor land cover classification. |
| Land Cover Change | Shows the change in the percentage of each land cover classification represented within location between 1992-2022. | This metric is derived from the Global Land Cover dataset (ESA), at 300m resolution, for the years 1992-2022. | Shows the change in the percentage of the total area that is classified as either anthropogenic or natural. |
| Protected Areas | Percentage of total land and marine area that is protected within a country. | This metric uses data from the World Database on Protected and Conserved Areas (IUCN, UNEP-WCMC). This metric is updated monthly. | The WDPCA is updated monthly and can be used to monitor changes in legally protected areas or, in conjunction with other datasets, monitor activity within and around protected areas. |
| Protected Connected Index | Percentage of total land area that is covered by connected protected areas, at distance thresholds of 1, 10, and 100 kilometres. | This metric pulls statistics directly from the BON in a Box ProtConn pipeline, which uses the WDPCA in calculating connectedness of protected areas. | The Protected Connected Index is an important indicator for assessing progress towards Goal A and Target 3 of the KMGBF, which aim to have 30% of land area protected by a network of well-connected protected areas by 2030. |
| Tree Cover Loss | Square kilometres of tree cover loss per year between 2001-2025 for a given location. | This metric is derived from the Global Forest Watch Annual Accumulated Tree Cover Loss dataset (UMD), at 30m resolution, from the year 2001 through 2025. | This information can help monitor when and where deforestation is occurring, as well as whether it is increasing or decreasing within your area of interest. |
| Monthly Fire Activity | Monthly square kilometres of burned area between 2001 and 2025 for a given location. | This metric is derived from the NASA MODIS Version 6 Burned Area data product, at 500m resolution, from the year 2001 through 2025. | Monthly fire activity can be analysed to monitor seasonal fire trends and report on increases or decreases in human-made and natural fires. |
| Biodiversity Intactness Index | Histogram showing the distribution of the Biodiversity Intactness data within the location. | This metric is derived from the Biodiversity Intactness Index data layer (UNEP-WCMC, NHML), at 1km resolution, from 2015. | This information illustrates whether habitat has become more intact or less intact, therefore affecting biodiversity over the area of interest. It can give insight into habitat destruction, fragmentation, or restoration. |
| Terrestrial Carbon Density | Total mass of carbon stored in soil and biomass and average carbon density within a location. | This metric is derived from the Terrestrial Carbon Density data layer (NatureMap, UNEP-WCMC), at 300m resolution, from the year 2010. | A time series of this dataset enables monitoring of carbon stored through nature-based solutions (vegetation and soil). |
| Enhanced Vegetation Index | Change in mean vegetation productivity between 2001-2025 for a given location. | This metric is derived from the Enhanced Vegetation Index (EVI) dataset (NASA MODIS), measuring the annual cumulative vegetation productivity from 2001 to 2025. | EVI can be used to monitor vegetative health over an area as an indicator of various abnormal conditions such as drought and changes in land use. |
| Terrestrial Human Industrial Index | Shows the change in distribution of human industrial index scores for a given location between 2000-2013, grouped into categories of 'highly intact', 'ecologically intact', 'converted', 'highly converted', and 'fully converted'. | This metric is derived from the Terrestrial Human Industrial Index (WCS, UNBC) from the years 2000, 2005, 2010, and 2013. | The Terrestrial Human Industrial Index can be used to monitor the impact of development and human infrastructure, on surrounding environments and areas of interest. |
| Coastal Eutrophication | Shows the change in distribution of coastal eutrophication trends through chlorophyll-a concentration proxies for given coastal and/or marine locations between 2007-2024, grouped into various categories defining the strength and direction of the eutrophication trend. | This metric uses the Global Eutrophication Watch, a geospatial framework for the preliminary screening of Coastal Eutrophication Potential (CEP). The version on UNBL uses the ESA-CCI (Ocean Colour Climate Change Initiative) 4km-resolution dataset as the primary input. | This metric can be used to identify environmental hotspots and monitor the progress of coastal water quality over time. |
| Sustainable Agriculture | Shows the country-reported data for KMGBF headline indicator 10.1 relating to progress towards productive and sustainable agriculture. | This metric displays the data supplied by each country to FAO. | Measures the land under productive and sustainable agriculture, expressed as a proportion of the country's agricultural land area through 11 sub-indicators. |
| Sustainable Forest Management | Shows the country-reported data for KMGBF headline indicator 10.2 relating to progress towards sustainable forest management. | This metric displays the data supplied by each country to FAO. | Measures progress towards Sustainable Forest Management through five subindicators, including annual forest area change, above-ground biomass in forest, proportion of forest area within legally established protected areas, proportion of forest area with a long-term management plan, and forest area under an independently verified forest management certification scheme. |
To view these metrics on UN Biodiversity Lab:
▶️ Prefer video? Click here!
-
Select a specific country or area of interest in the 'PLACES' tab.
-
Review the metrics in the left panel. Choose between a list of the ten terrestrial dynamic metrics, marine metric, or two headline indicators by clicking and selecting the preferred option - 'Metrics', 'Marine metrics', 'Headline indicators' - from the displayed dashboard.
-
Click on the toggle button next to any specific metric if you want to view this dataset on the map. Click on the toggle button again or the remove dataset icon on the legend to clear the screen.
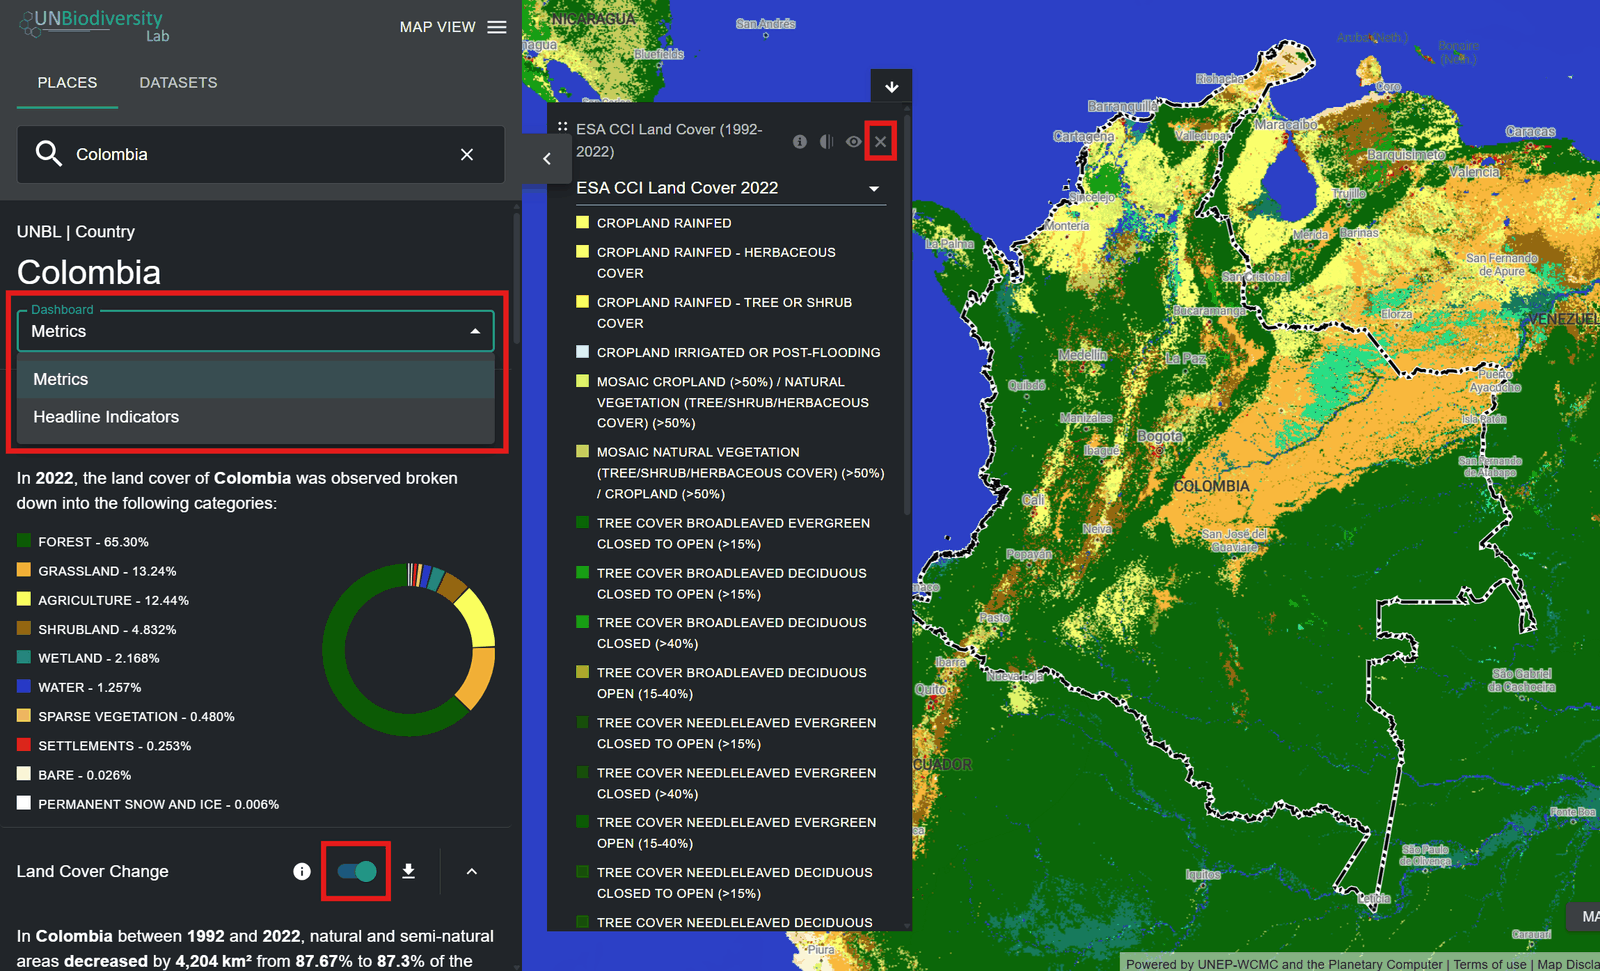
Figure 1: Colombia metrics with Dashboard menu, a metric toggle and legend remove icon highlighted -
Click on the
 icon to view dataset info. The info pages provide a brief description of the data, related paper to read, raw data to download (if freely available) and licence specifications.
Figure 2: Information -
To download summary data for the metric in .csv, .tsv or .json format, click on the arrow icon
 . You can also download the data from source links on the datasets’ info pages.
Figure 3: Download 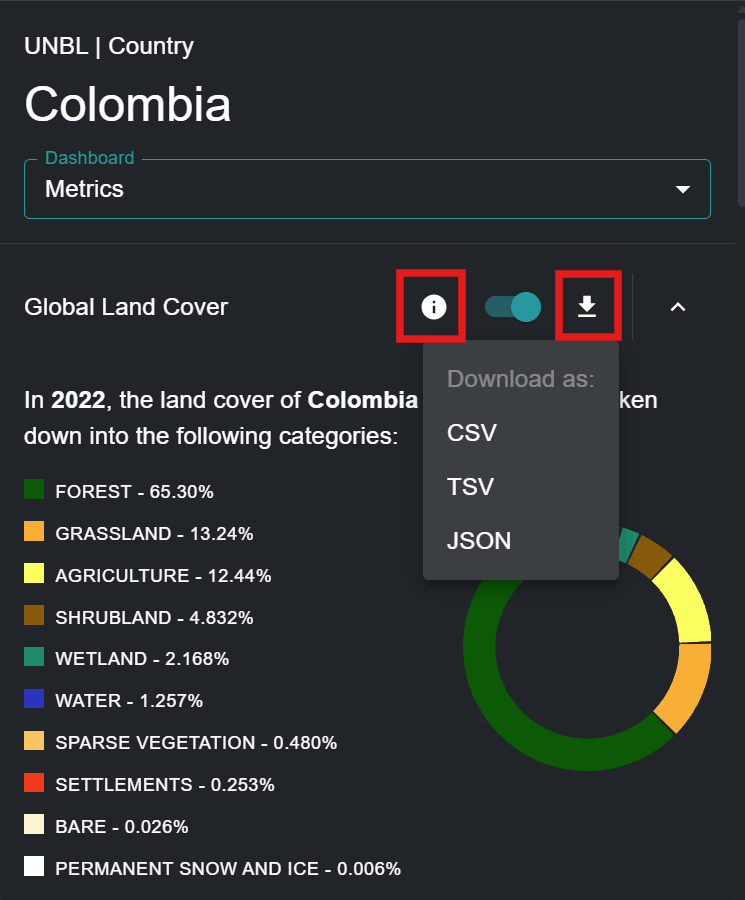
Figure 4: Global Land Cover metric with info icon and CSV, TSV, JSON download menu highlighted